ABL Guidance for Construction Equipment: Key Focus Areas (Part 1 of 3)
As an asset-based lender your goal is to minimize your risk exposure and optimize the financing structure and availability for your borrower. Rouse takes a ‘360’ view on tracking all aspects of the construction equipment market by maintaining the most complete database of secondary market transactions to tracking key market indicators. In this three-part series we’ll explore the critical areas that ABL teams can focus on to ensure proper management of the credits in their machinery & equipment portfolios. In part one of this series we’ll begin with a focus on understand the market. The first element of this is…
Market Tracking
Lenders need to maintain a sharp view and focus on what is currently happening in the marketplace for construction equipment. Values tend to move in cycles and dependent upon the cycle should be evaluated accordingly. Through the rich data set of transactions that Rouse collects and manages, Rouse has developed a real-time index that tracks construction equipment values dating back to the 2000’s, as seen below:
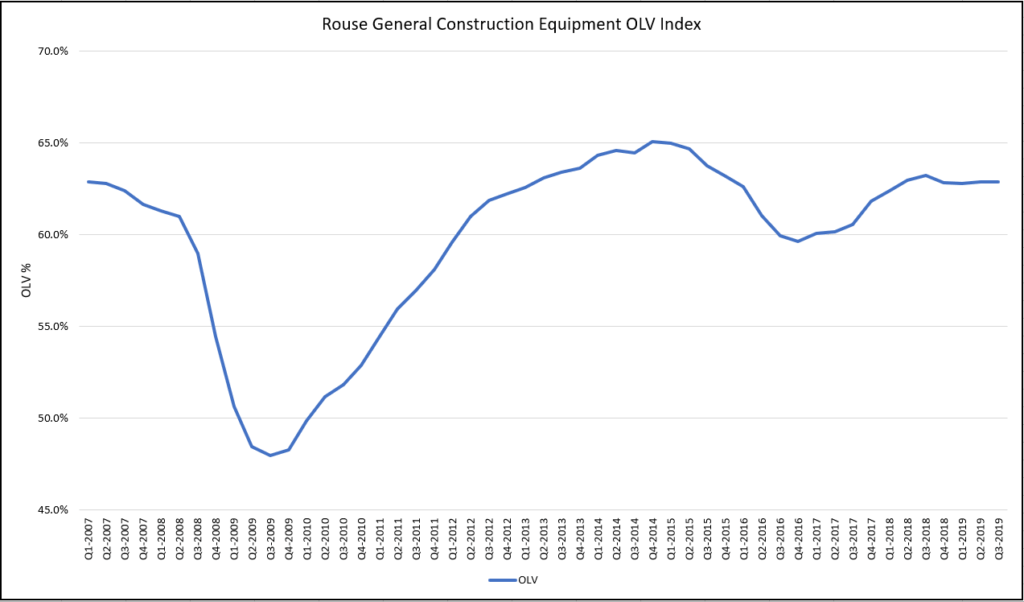
Each monthly data point illustrated above represents the average recovery, as a percentage of cost, for ten different model years of equipment ranging from new to nine years old, with each year weighted equally. The categories contained within include, aerial equipment, telehandlers, support equipment, and small-medium earthmoving equipment, each having an equal impact.
Is the market in a state of growth? Are we at peak levels? Should we anticipate a future downturn? These are all questions a Lender should look to contextualize within the ABL structure and plan for as they may have adverse / favorable effects on future availability. Rouse tracks secondary market values and trends on a month-to-month basis, making the trends available for customers through our monthly Equipment Report. Keeping an eye on the current and future market values provides insight into planning ahead and enables you to assess proposed changes to the borrowing base as well as to…
Understand the ‘Downside’
There should always be a plan for the ‘worst case’ scenario and reserves should be managed accordingly. Below we examine two recent use cases of market downturns and their effects on equipment values.
“Great Recession” declines versus “Mini Recession” declines. In the value index chart shown above, we show the time period from 2007 through 2018. Declines in the 2008/09 Great Recession were severe and swift moving down ~21% on a relative Basis for OLVs (holding the fleet profile and age constant). The downward movement is most extreme for the auction channel of sale (FLV) where peak-to-trough movements were ~-32%. If we look to the slowdown in late 2014 / early 2015 which was precipitated by the decline in Oil and Gas prices we observe a more moderate reduction in values of ~8.4% on an OLV basis steadily over a period of roughly two years.
| Q2 2008 peak pre-drop | Q3 2009 trough | Peak-to-Trough | Q4 2014 peak | Q4 2016 trough | Peak-to-Trough | |||||
| FMV | 69.6% | 60.2% | -13.5% | 77.1% | 73.1% | -5.2% | ||||
| OLV | 61.0% | 48.0% | -21.4% | 65.1% | 59.6% | -8.4% | ||||
| FLV | 52.4% | 35.7% | -31.8% | 53.1% | 46.2% | -13.0% |
The implication in terms of the potential borrowing base and asset values is that there might need to be appropriate asset and capital management to guard against observed declines in values for the equipment. These market movements can play out in a variety of ways depending upon the profile of the asset base which is why it’s critical to…
Keep a pulse on the Collateral
Lenders need to stay ahead to changes in the portfolio to ensure risk is minimized. Too often do we visit a fleet annually or bi-annually to find that values and key lending ratios have shifted dramatically since the prior appraisal. There are a multitude of factors which might drive this including:
- Market Conditions
- Changes in fleet age
- Changes in fleet mix
- Acquisitions
- Fleet Maintenance
- Accounting Practices / Depreciation Policy
It’s important to understand how each of these might drive values and lending ratios, such as the Net Liquidation Value vs. the Net Book Value, up or down. For example, as the company invests in a different type of equipment with less liquidity and a weaker value recovery this might impact availability projections. These changes tend to be gradual as companies manage their fleets. However, over the course of a period of six months or more these changes may move enough that an updated appraisal can have a meaningful impact to availability / liquidity. Tracking these and having regular conversations with the company enables planning so any changes are baked into the borrowing base. A best practice is to include the optionality to trigger an additional appraisal should material changes happen either with the market, the company’s performance or otherwise.
In the next part of this series we’ll plan to dive deeper into some of the specific components and elements that should be considered as part of the ABL setup and management.
For further information or discussion feel free to contact Raffi Aharonian (Raffi.Aharonian@rouseservices.com) or Jacob McCarthy (Jacob.McCarthy@rouseservices.com).
Recent Comments