Now is the time to sell, but why are prices so strong?

Market update from Raffi Aharonian, Managing Director of Rouse Appraisals

With the landmark Orlando auction officially in the books—attracting 26,000+ bidders and generating US$213+ million in gross transaction value—it’s a good time to take a step back and see where the market has been and where it might be headed.

Since the onset of the pandemic in early 2020, we have experienced interesting market dynamics develop, carrying forward to present day where we are driving very strong pricing for consignors, but how did we get here?

Initial Pandemic Response

After the initial shock of global lockdowns in Q1 2020, we saw markets react abruptly with some sharp price reactions. For the equipment industry, the good news is downward pricing moves were short lived, on the back of the essential nature of construction work. Despite that, looming uncertainty caused a lot of disruption in terms of normal fleet replacement cycles. Rental companies, OEM dealers, and contractors deferred or cancelled orders placed earlier in the year, and many began selling equipment to right-size fleets in the event of a prolonged downturn.

Supply Shortfalls

As the demand for equipment continued to pick up throughout the end of 2020 and into 2021, we saw a combination of effects take hold. First, equipment owners sought to add to their fleets, calling on manufacturers for new orders, leaving manufacturers with extended lead times, on account of re-upping their production capacities to meet the sudden, renewed demand. Alongside that, the world saw supply chain disruptions and chip shortages, exacerbating the supply dilemma.

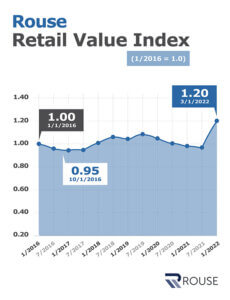
As a result, beginning in Q1 2021, used equipment pricing heated up, surpassing pre-pandemic levels, and eventually surpassing prior-peak levels, reaching a new five-year high. To date, we have not seen any slowdown in price increases for used equipment.

Demand Dynamics

While supply issues are continuing to make headlines across all industries, one of the untold stories of the pricing dynamic rests with the healthy levels of demand observed across the equipment industry. Total construction spend continues to rise, and manufacturers continue to report strong backlogs for equipment.

The demand story is particularly telling, by way of utilization trends across the rental industry, tracked uniquely by Rouse Analytics. In 2021, we observed rental utilization—a measure of demand for equipment out of rental fleets—exceeded levels achieved in 2020 and 2019.  Further to that, YTD 2022 is demonstrating utilization levels that exceed the same time frame for each of the three preceding years. This, on the back of increasing fleet levels, indicates demand for equipment from end users and contractors remains very strong.

Present Day

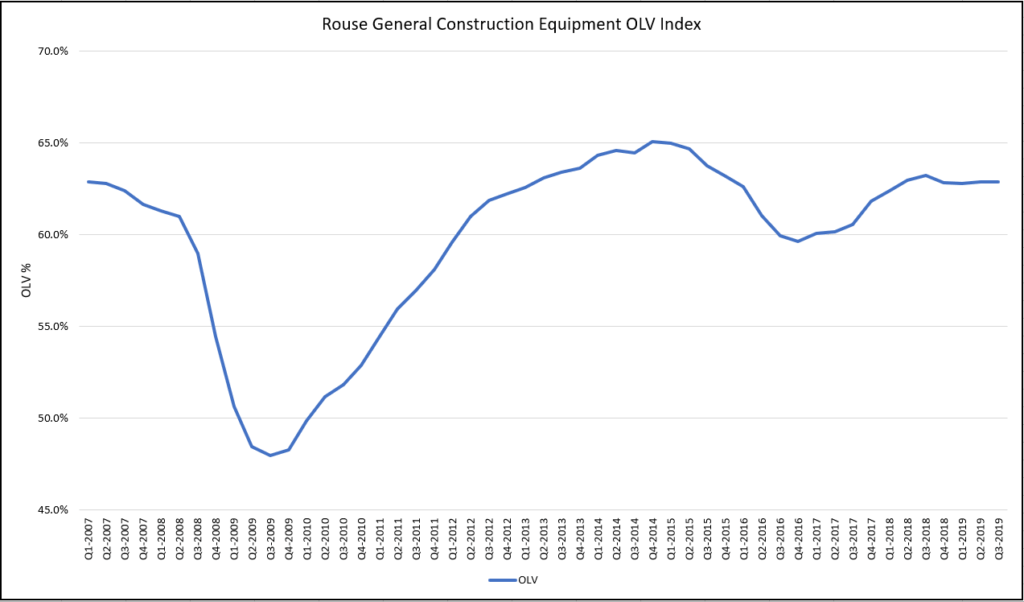
As we look at the Rouse Value Index for auction pricing above, it’s clear pricing has reached recent highs, driven by a combination of supply challenges and strong buyer demand.

Importantly, as we look at price realization in the annual Orlando auction last month, we see pricing continuing to inflate.

To learn more about Rouse and its services, visit rouseservices.com.

Through the Lens: Collateral Monitoring in Turbulent Times

With uncertain times comes market stress.  In such periods, it becomes critical for stakeholders to put a watchful eye on key metrics and market trends.

In this update, Rouse provides equipment industry stakeholders with helpful direction on the key factors for consideration – while some may be company (credit) specific, others represent broad market characteristics.  A careful examination of these topics will begin to reveal the story for the latest market trends and may help identify the key inflection points.

Secondary Market Activity

Secondary market activity is ultimately the best source of information for understanding trends in collateral values.  Many stakeholders have been surprised to learn that second-hand buying and selling of construction equipment has been quite robust amid the prevailing uncertainty from March through May of 2020.  With a closer examination of this activity, one should focus on two key attributes:

i) Pricing achievements – willingness and ability to pay will no doubt be a sign of the times and can provide a gauge for demand through challenging market environments.

ii) Sales volumes – along with pricing trends, selling volumes (i.e. unit sales) should be weighed into the thought process. Fluctuations in volumes could provide insight into supply and demand across different sales channels, but nonetheless should be closely monitored in order to accurately identify the trends in the market.

Fleet Utilization

Within the context of a rental business, physical utilization can serve as a true and real-time indicator for demand.  Stakeholders should be keen to monitor this on a standardized measure while adjusting for seasonality and geographic market and drawing comparisons to utilization achievements in prior years.

OEM & Dealer Activity

During periods of market weakness, it is not uncommon to see manufactures and dealers demonstrate reduced production activity and reduced sell-through of new stock as demand begins to decelerate.  While manufacturers can be swift in adapting to declines in demand by cutting production, as demand for equipment returns there may be a supply constraint on account of production lags.  This phenomenon may lead to a short-term supply and demand imbalance that can, in turn, lead to an improvement in pricing for used equipment as buyers turn to secondary markets to acquire products needed to fulfill their construction projects.

Capex plans

Equipment rental companies and other users of construction equipment tend to be responsive to changes in the market by reconfiguring their capex plans quickly as changes begin to develop.

In recent times, many companies have significantly reduced their capex budgets for the year.  As this takes hold, the replacement cycle becomes impacted as rental companies will look to reduce net new purchases and instead manage the fleet they have – either in the form of disposing older and underutilized assets or by allowing the fleet to age out.  As a result of this phenomenon, stakeholders should be watchful of fleet age (in comparison to industry benchmarks) as well as changes to maintenance spending and the percentage of down-line machines.

For more detail on any of these topics, please reach out to your Rouse representative to set up time for a deep dive on the latest market developments.

Keeping a pulse on the equipment quality, movement, and activity helps you head off and plan for any trends or issues that might be emerging within the collateral base. In different economic climates various risks emerge that can be mitigated via close monitoring and communications with the client. These key monitoring areas can be seen below:

  • Equipment Maintenance
  • Utilization
  • Capital Expenditure
  • Market Tracking

In tracking these it’s important to understand the company’s data and operations management systems, establish a clear line of reporting on a monthly basis, and know the context and impact of the data you might request and review.

Equipment Maintenance: Maintaining Quality

The condition and quality of the fleet is a key driver in the salability and value of the collateral. In times of uncertainty and business challenges companies often identify maintenance as an area to save and improve cashflow. Decreased maintenance might reduce cash availability downstream as appraisal inspections are conducted. Lenders should consider tracking:

• How has the maintenance spend been tracking?

• What is the volume of down units on a month to month basis, what’s the average down time?

• Are the assets still being maintained in accordance with OEM standards?

Answering these questions should provide certainty that the collateral quality has not deteriorated. Should there be any issues an additional inspection might be discussed to check the physical condition of the assets.

Utilization: Collateral Performance

Lenders are rightfully monitoring cashflow on a month-to-month basis. However, this singular view might not provide the complete story on how this figure might shifting each month. Observing utilization can better help understand seasonality, cashflow trends, and returns on the different types of collateral the company owns.

When looking at construction equipment and rental / dealer operations there are a couple key metrics which should be considered: physical utilization and financial utilization. A clear handle on both of these should help in both understanding variability in cashflow and how that might be trending on a future basis.

CAPEX: Changing Fleet Composition

As companies make investments and manage their equipment base the expenditures in fleet investment will naturally be tied to the borrowing availability at any point in time. As expenditures slow the company will likely be faced with a reduced credit facility in the next appraisal. Likewise, when companies invest in asset types divergent from their core the availability on those assets may be more or less than what they might forecast. Understanding the potential value on these should reduce friction as these come into the facility and companies can understand the cash output they might need.

Market Tracking

Lastly, lenders should be aware and keep an eye on key market drivers that might impact end markets in which their collateral is utilized. Most recently, the decline in oil prices has impacted key segments of the construction equipment market such as mobile cranes. Independently, COVID-19 has driven underperformance in the secondary market across equipment types in drastic ways over the past few weeks. Regular communication around these with your appraiser will enable better modeling and prediction in collateral values in between appraisals.

A comprehensive collateral monitoring approach is key as it reduces any potential looming risks that might only be picked up in the appraisal and keeps lenders and borrowers eye-to-eye.
This concludes the series on ‘ABL Guidance for Construction Equipment.’ Hopefully, this will provide more tools and strategies for managing your Asset Based Lending business and for engaging with your customers.

COVID-19 has driven a high level of uncertainty in the market as the estimated end point is unknown and economic implications are changing on a day to day basis. Rouse has been tracking this in detail and can provide a more complete overview of this were beneficial.

For further information or discussion feel free to contact Raffi Aharonian (Raffi.Aharonian@rouseservices.com) or Jacob McCarthy (Jacob.McCarthy@rouseservices.com).

Decoding the Market: Equipment Lease Considerations

As any lease finance professional will attest, there are numerous factors to consider when establishing lease terms, rates, and residual values for potential customers.  Many of these factors are specific to the customer and their business, whereas some factors pertain directly to the equipment under consideration.  Although not all-encompassing, there are four key elements to evaluate as it relates to the equipment itself:

  • Product characteristics
  • Asset characteristics
  • Market liquidity
  • Economic cycles

Asset managers often struggle to find ways to solve for these efficiently.  A clear understanding and a full view of information is a critical component of risk assessment and sound decision making.

In this update, Rouse addresses these needs with a self-service solution for the lease finance community.

Product Characteristics

As obvious as it may seem, a clear understanding of key product characteristics will go a long way in establishing a view on residual risk.  Lessors should be sure to evaluate the manufacturer, the specific model, the year of manufacture (model year), and the geography of lease.  Each one of these will serve as the foundation to the underlying value of the asset in question.

For example, a good understanding of the brand recognition of the manufacturer can drive the acceptance of their products in the market and, in turn, the marketability and recoverability of the asset at end of lease term.  Likewise, the model range (product class) will provide an indication for the popularity of the specific product versus any edge case / specialty nature to the product.

Asset Characteristics

As one might expect, not all models are created equal.  Within any product line, models can be configured quite differently.  Highly configured assets can drive material differences in value versus those with only the “base” options.

Allowable usage (meter reading) during the lease term is another critical factor that effects residual value.  Similarly, lessors should assess the application for which the equipment will be used and their experience with the particular customer in order to determine the condition of the asset they might receive at the end of the lease.  Heavily used and worn assets (cosmetically and mechanically) will oftentimes yield a meaningfully lower value at resale.

A good understanding of asset characteristics can minimize any unwelcome surprises during the asset recovery stages of the lease life.

Liquidity

At the end of the lease term the asset must be remarketed if not purchased by the customer.  The channel of sale can yield differing sales results:  how regularly does the product trade in the open market across retail and auction channels? It is critical to have a solid view of total market liquidity across all key channels of sale in order to develop an appropriate risk assessment and residual value.

Economic Cycles

Perhaps the most elusive characteristic for most lessors is a good handle on economic cycles and peak-to-trough movements in equipment values.  Knowing current economic conditions will be helpful but limiting in terms of establishing a view on residual values several years into the future as markets move.

However, visibility into peak conditions as well as recessionary conditions – in comparison to the current environment – can help lessors develop a clear view on where to peg residual values for new leases.


Only Rouse’s Residual Value toolkit unlocks the potential to holistically study the market from these critical angles.  Bringing reliable information together in one place empowers lessors to efficiently make accurate and educated decisions on residuals.

Contact Rouse today to learn more: residuals@rouseservices.com

Appropriately structuring the Asset Based Lending facility is critical to the success and ongoing performance of the credit. In setting up the structure for the facility it’s important to consider a range of factors covering:

  • Data Integrity
  • Asset eligibility and amortization
  • Accounting policies

A miss in any of these areas can have downstream effects that might lead to uncomfortable conversations with the borrower or even a scenario where under seemingly benign market conditions the lender is now in an ‘over advanced’ position and must trigger a repayment from the borrower. In the worst instance, a lender might extend financing on collateral that’s ineligible or is inaccurately valued as the client’s information, such as the model year, was incorrect.

Data Integrity: Quality in, quality out

A key variable in the appraisal process is the company’s asset register. To the extent there is any errant information within the file this can drive a large disconnect in the appraisal values and create stress in the borrowing base as this persists. Any missing information should be prioritized so borrowers are held to a standard that supports an accurate lending facility. A lender should partner with the appraiser to ask key questions around:

  • What’s driving the cost / NBV provided? Does the cost appear to be reasonable based off the nature of the purchase (new or used) and is the NBV accurate? Has cost been remarked based off a balance sheet review to a value other than acquisition cost such as Fair Value or a prior NBV as an asset was transferred?
  • Are the model years representative or have they been derived from the acquisition date?
  • Do they track and report on the usage, configuration, location and status of the assets?

Asset Management: Eligibility and Amortization

Within any collateral pool, there are often individual assets or groupings of assets that may not be suitable for inclusion in a borrowing base. This can include:

  • Down Units: Companies typically run a constant line of down assets and it’s natural for units to cycle in / out of this bucket. In a distressed situation, where capital is limited, maintenance can become a lower priority. It’s possible for these to be neglected and these assets can be ‘red flags’ for prospective liquidation buyers
  • Low Cost / Accessory Components: Often borrowers will have a supplemental inventory of attachments and other various low-cost items that support their core business. These assets may be not clearly tracked or easily identified. Dependent on these factors, these might be a candidate for ineligibility
  • Old / Obsolete Assets: While the concept of ‘slow-moving’ assets or obsolescence is most often reserved for inventory valuations, there are scenarios where you might also consider this when looking at construction equipment. Is the asset no longer used or perhaps technologically obsolete? Is the age well past the typical observed in the market?

Trying to find opportunities to ‘squeeze’ dollars out of the assets most often leads to false inflation in the availability.

It’s common within ABL facilities, especially in cases where appraisals are less frequent, to incorporate an amortization factor on the outstanding balance. Within the construction equipment domain there are a variety of assets a company might own for different applications from high cost wear and tear rigid mining trucks to low impact skid steer loaders.  Likewise, different asset classes can oftentimes exhibit varying degrees of deprecation.  A good understanding of these variable residual value depreciation rates can enable a borrowing base structure that aptly aligns with the collateral in question.

Accounting Policies: Depreciation and its implications

Assets can be deployed / utilized in a variety of functions within a company’s business and often dependent upon this they have a different depreciation policy assigned to them. Lenders should ask: Is the policy reasonable? How would this impact my projections as I model future availability? Overly ‘aggressive’ policies will lead to high volatility in the advance rate as assets tend to lose value at a rapid rate and the resultant minimized NBV denominators can cause high fluctuation in key lending ratios. Likewise, overly conservative policies lead to natural questions from a borrower around “Why is my NBV higher than OLV? This doesn’t make sense.” A reasonable and understood policy will minimize these sorts of questions and help in modeling future advance rates. Similarly, most equipment rental / dealer companies will have a New Stock, Used Stock, and Rental business division. These divisions might all be subject to different depreciation policies and potentially recovery characteristics, generally sales stock is not depreciated where rental assets are. Developing an advance rate against each of those is key so changes to the mix of these business units don’t impact availability.

Lenders should be keen to establish the best foundation possible for the Iending facility and the Appraiser should serve as a key partner in helping assess the potential fleet. In the final part of this series we’ll discuss key areas for collateral monitoring as part of the ongoing ABL management.

For further information or discussion feel free to contact Raffi Aharonian (Raffi.Aharonian@rouseservices.com) or Jacob McCarthy (Jacob.McCarthy@rouseservices.com).

Know the Value: Taking the Guesswork out of Residuals

After years of service in providing current equipment valuations in the form of appraisals in support of lending facilities and remarketing support for rental companies, contractors, and dealers, Rouse is pleased to announce the latest offering to stakeholders: Rouse Residual Values.

By leveraging its vast pool of equipment fleet and sales transactions, Rouse delivers estimated residual values via a customer-facing self-service portal across a wide range of equipment including aerial work platforms, telehandlers, heavy earthmoving, cranes, trucks, and trailers.

Rouse collects over $14 billion in new and used equipment sales transactions annually and, by leaning on historical sales observations, generates estimated residual values for equipment up to eight (8) years into the future.

The tool set is ideal for lease finance institutions who are looking for a single source that arms them with all the information they need to make intelligent underwriting decisions.  Likewise, for equipment owners, this tool serves as a reliable source of market intelligence for assessing fleet management decisions.

Rouse provides its users with access to asset-specific values that consider the key factors to valuation, including:

  • Product type characteristics
    • Manufacturer,
    • Specific models, and
    • Year of manufacture (age)
  • Asset-specific characteristics
    • Meter/Usage (current and future estimated)
    • Configuration, and
    • Geography (region specific within the US and Canada)

This, combined with the ability to stress-test the residual values according to varying economic conditions, provides the best source of information for those looking structuring lease deals or to those looking to make fleet management decisions.

Lease finance institutions can use the current values provided in the tool to evaluate existing leases both as a matter of periodic portfolio monitoring exercises and to determine appropriate pricing to facilitate remarketing as leases come due.

Additionally, Rouse aggregates publicly available sales transactions and provides them in one centralized location within the portal.  This arms users with a streamlined source for analyzing market data.

Rouse will be presenting this unique offering during ELFA’s annual equipment management conference in Orlando, FL from February 24th – February 25th, at exhibit booth #35.  For further information please contact info@rouseservices.com

State of the Trucking Industry

As trucking companies head into 2020, the industry landscape appears challenging as declining freight demand, spot rate erosion, increasing transportation costs, and other market pressures contribute to a tough business environment. Rouse observed consistent softness in used truck values throughout 2019 in the auction markets, and this trend may persist in the new year as the latest industry indicators point to an unchanged outlook.

These industry dynamics are apparent in recent value trends. Rouse tracks auction data for truck tractors in addition to construction equipment. Below is a chart of the FLV value trend of both truck tractors and general construction equipment, which is an aggregation of aerial, telehandler, earthmoving, and support equipment.

Focusing on the most recent two years in the chart below, 2018 auction sales displayed an upward trend mirroring the relative strength in the trucking industry. In 2019, the aforementioned market forces caused a pullback in the industry which impacted used truck sales prices. Values consistently exhibited a weakening recovery profile across the breadth of truck brands and used vintages. While general construction equipment has also experienced similar fluctuations over the past several years, the impact of market forces was not as significant on general construction equipment values. Trucking companies face a unique set of challenges and values are more susceptible to volatility.

2018 was a strong year for the transportation and logistics industry as many companies posted record revenues driven primarily by high load rates. Trucking capacity was constrained by the driver shortage and demand was heightened as companies wanted to deliver their goods prior to the impending tariffs on China. Spot rates were well over $2.00 per van truck load mile through all of 2018, driving a surge in revenues.

As a result of the booming market in 2018, trucking companies fleeted up heavily to both capitalize on expanding margins and to beat the tariff increases. Logistics companies purchased a record number of class 8 tractors. However, this increased investment in new trucks led to an oversupply in the market. Furthermore, the Cass Freight Index indicates that freight shipment volumes declined in 2019 relative to prior year. The combination of weakened demand and increased supply drove down truckload rates. For most of 2019, van rates fell into the $1.80’s according to DAT’s rate data.

Other challenges included rising insurance rates and persistent driver shortages, which forced transportation companies to raise driver pay. As a result, revenues declined and expenditures increased, leading to significant financial pressures and resulting in the spike of bankruptcies in 2019.

The recent bankruptcy filing by Celadon, one of the largest logistics and transportation companies in North America, is illustrative of the current struggles of many companies in the industry. Celadon is the latest notable shutdown, adding to the tally of 795 carriers that have gone bankrupt through 3Q19 according to transportation data firm Broughton Capital. This count is double the number of trucking bankruptcies through the same period in 2018. Although 2018 marked a strong year for the logistics industry, 2019 quickly turned due to a softening spot rate environment, falling demand, and increasing costs of driver pay and insurance.

Although Celadon represents only a small fraction of the total industry, the broader market picture displays significant economic headwinds in the current climate. Slowing freight demand has caused order books for heavy-duty truck manufacturers to decrease and new truck orders are returning to normal market levels. In 2020, the environment is uncertain and trucking companies are being cautious. The used truck market continues to display weakness in value recovery. Rouse will track and report on this data as the year unfolds.

Rouse collects and tracks over $550 million of truck tractor sales and $160m of trailer sales annually spread across nearly 750 tractor models and over 4,000 trailer models. This information is used to conduct studies and analyses of used truck and trailer value trends by incorporating make, model, year, mileage, brand, region, and other factors that may be consequential to the valuation needs of our clients and for us to deliver the most accurate valuations in the industry.

ABL Guidance for Construction Equipment: Key Focus Areas (Part 1 of 3)

As an asset-based lender your goal is to minimize your risk exposure and optimize the financing structure and availability for your borrower. Rouse takes a ‘360’ view on tracking all aspects of the construction equipment market by maintaining the most complete database of secondary market transactions to tracking key market indicators. In this three-part series we’ll explore the critical areas that ABL teams can focus on to ensure proper management of the credits in their machinery & equipment portfolios. In part one of this series we’ll begin with a focus on understand the market. The first element of this is…

Market Tracking

Lenders need to maintain a sharp view and focus on what is currently happening in the marketplace for construction equipment. Values tend to move in cycles and dependent upon the cycle should be evaluated accordingly. Through the rich data set of transactions that Rouse collects and manages, Rouse has developed a real-time index that tracks construction equipment values dating back to the 2000’s, as seen below:

 Each monthly data point illustrated above represents the average recovery, as a percentage of cost, for ten different model years of equipment ranging from new to nine years old, with each year weighted equally. The categories contained within include, aerial equipment, telehandlers, support equipment, and small-medium earthmoving equipment, each having an equal impact.

Is the market in a state of growth? Are we at peak levels? Should we anticipate a future downturn? These are all questions a Lender should look to contextualize within the ABL structure and plan for as they may have adverse / favorable effects on future availability. Rouse tracks secondary market values and trends on a month-to-month basis, making the trends available for customers through our monthly Equipment Report. Keeping an eye on the current and future market values provides insight into planning ahead and enables you to assess proposed changes to the borrowing base as well as to…

Understand the ‘Downside’

There should always be a plan for the ‘worst case’ scenario and reserves should be managed accordingly. Below we examine two recent use cases of market downturns and their effects on equipment values.

“Great Recession” declines versus “Mini Recession” declines.  In the value index chart shown above, we show the time period from 2007 through 2018.  Declines in the 2008/09 Great Recession were severe and swift moving down ~21% on a relative Basis for OLVs (holding the fleet profile and age constant).  The downward movement is most extreme for the auction channel of sale (FLV) where peak-to-trough movements were ~-32%.  If we look to the slowdown in late 2014 / early 2015 which was precipitated by the decline in Oil and Gas prices we observe a more moderate reduction in values of ~8.4% on an OLV basis steadily over a period of roughly two years.

Q2 2008 peak pre-drop Q3 2009 trough Peak-to-Trough Q4 2014 peak Q4 2016 trough Peak-to-Trough
FMV 69.6% 60.2% -13.5% 77.1% 73.1% -5.2%
OLV 61.0% 48.0% -21.4% 65.1% 59.6% -8.4%
FLV 52.4% 35.7% -31.8% 53.1% 46.2% -13.0%


The implication in terms of the potential borrowing base and asset values is that there might need to be appropriate asset and capital management to guard against observed declines in values for the equipment. These market movements can play out in a variety of ways depending upon the profile of the asset base which is why it’s critical to…

Keep a pulse on the Collateral

Lenders need to stay ahead to changes in the portfolio to ensure risk is minimized. Too often do we visit a fleet annually or bi-annually to find that values and key lending ratios have shifted dramatically since the prior appraisal. There are a multitude of factors which might drive this including:

  • Market Conditions
  • Changes in fleet age
  • Changes in fleet mix
  • Acquisitions
  • Fleet Maintenance
  • Accounting Practices / Depreciation Policy

It’s important to understand how each of these might drive values and lending ratios, such as the Net Liquidation Value vs. the Net Book Value, up or down. For example, as the company invests in a different type of equipment with less liquidity and a weaker value recovery this might impact availability projections. These changes tend to be gradual as companies manage their fleets.  However, over the course of a period of six months or more these changes may move enough that an updated appraisal can have a meaningful impact to availability / liquidity. Tracking these and having regular conversations with the company enables planning so any changes are baked into the borrowing base. A best practice is to include the optionality to trigger an additional appraisal should material changes happen either with the market, the company’s performance or otherwise.

In the next part of this series we’ll plan to dive deeper into some of the specific components and elements that should be considered as part of the ABL setup and management.

For further information or discussion feel free to contact Raffi Aharonian (Raffi.Aharonian@rouseservices.com) or Jacob McCarthy (Jacob.McCarthy@rouseservices.com).


Transaction Trends

The strong economy of recent years has brought increased growth to the equipment rental industry. Increased preference for rental over ownership (i.e., higher degree of rental penetration) has contributed to this growth. The industry has also experienced a high degree of acquisitive growth via consolidation of local, regional, and national companies.

Like many other highly fragmented industries, the equipment rental industry has been primed for consolidations.  Since United Rentals acquired RSC in 2011, the industry has witnessed a significant amount of consolidation in both landmark deals and smaller bolt-on acquisitions.

Let’s take a closer look at the transaction environment since 2011, highlighting the transaction multiples observed across the various industry verticals.  Rouse has evaluated more than 120 transactions between equipment rental companies from 2011 to 2019 to showcase their patterns and outcomes.

The common metric for deals in the sector is purchase price as a multiple of trailing 12 months’ EBITDA, or the EV/EBITDA multiple.

Across the industry, the average transaction multiple in the North American market (US and Canada) is 7.1x, with nearly 70% of deals trading at multiples between 5.0x and 8.0x.  Within the European market (including the UK) the average is a little bit lower, at 6.4x, with the majority of deals trading at multiples between 4.5x and 7.5x.

Rouse sees companies that operate in a specialty vertical (traffic solutions, tanks/pumps, etc.) trading at higher multiples, in some cases reaching as high as 9.0x.

Many transactions take place outside the ranges stated above.  Rouse has observed that transaction multiples can vary for a number of reasons, including strategic value, target profitability, and expected synergies via acquisition, as well as situational characteristics such as bankruptcies and market cycles.

No matter the circumstances of a sale, stakeholders across the industry should have a good understanding of the observed transaction multiples.  This becomes important for business owners (buyers and sellers), asset-backed lenders, private equity owners, and corporate finance advisors.

For more information about transaction trends, please contact Raffi Aharonian at Rouse Services (Raffi.Aharonian@rouseservices.com).