In today’s world, data drives many different businesses and industries, and the construction equipment industry is no different. Although data on its own is useful, the power of information magnifies with the application of sound data science techniques.
At its core, the data science life cycle includes an understanding of the business use case for the information; but, in order to drive to actionable conclusions, the data science process incorporates some key steps:
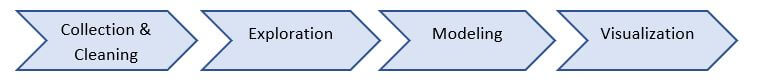
In this post, we will explore how data science can be utilized to inform original purchase costs for a range of models within a product line in a program we call Model Chaining.
Data Collection and Cleaning
By virtue of its extensive client network, Rouse employs real world data in the modeling processes. The data collection process relies on obtaining vast and accurate data from both clients and publicly available information. In a perfect world, every single data point we receive would be perfect and usable, but the realities of disparate data sources do not always accommodate that ideal. As a result, a robust cleaning process is imperative to transform raw data into a standardized set of usable information.
When the data has been standardized, it is ready for analysis. A standardized measure of equipment costs is assigned to each machine, and analysis is done to check for any statistical anomalies in the costs sets. The assignment, checks, and additional analysis are done with computer programs at Rouse. We use statistical analysis and machine learning to do so, but before we begin, there are additional steps that are an important part of the data science cycle that we use before getting to the modeling portion.
Data Exploration
The data exploration step of the data science cycle typically is where we look at our cleaned existing data to see if we can find patterns it to base our modeling on. In the Model Chaining program, where we look at machine replacement cost, we expect larger machines to have a larger replacement cost. We use these types of patterns to build our data models, resulting in a more accurate value.
Another part of exploration involves sorting through the cleaned data. One example of this is the John Deere “G” series excavators. We group machines together based on the naming schema John Deere chooses for compact, mid, and large size excavators. By differentiating them into sensible groupings, we do not allow the results of very large or very heavy machines to skew the output of the program for smaller machines.
Data Modeling
The Model Chaining program uses machine learning to both generate and check these machine replacement costs. This is applicable even in cases where the sample size is limited.
In cases with limited data points, being able to generate a good cost value is critical. Where simple statistical averaging can result in illogical cost results for adjacent products within a model range, Rouse’s Model Chaining offers a holistic view that considers a replacement cost for any single model relative to the replacement costs observed for its cohort group.
Data Visualization
With the use of logarithmic regression models, we can visualize Rouse’s Model Chaining outputs as a linear plot, thereby making it easy to identify anomalous results. This crucial step of outlier identification then allows for further research on the data inputs such as clarification of machine specification or location and elimination of faulty data. In addition to covering specifically replacement costs, but the same type of plotting can be done with retail sale value vs spec or auction value vs spec as well.
Visualization in data science allows us to see what our data looks like and we use it in addition to the mathematical model it is based on. It is especially useful when presenting data to clients and we use this visualization and other types across all departments at Rouse to help our clients gain a better understanding of data.
Conclusion
The value checking program we call Model Chaining, demonstrated above is one of the many machine learning models that Rouse uses to generate the best value to our clients. Although this example focused on replacement costs of machines, we also employ this same time of modeling for both retail and auction market values and as well as for each model year of machines. We take pride in following the data science cycle fully and backing our values with real world data coupled with our domain expertise and deep understanding of the equipment rental industry. Machine learning allows us to develop new insights quickly, easily, and accurately and Rouse hopes to bring these insights and others to all our clients.
Recent Comments