State of the Trucking Industry

As trucking companies head into 2020, the industry landscape appears challenging as declining freight demand, spot rate erosion, increasing transportation costs, and other market pressures contribute to a tough business environment. Rouse observed consistent softness in used truck values throughout 2019 in the auction markets, and this trend may persist in the new year as the latest industry indicators point to an unchanged outlook.

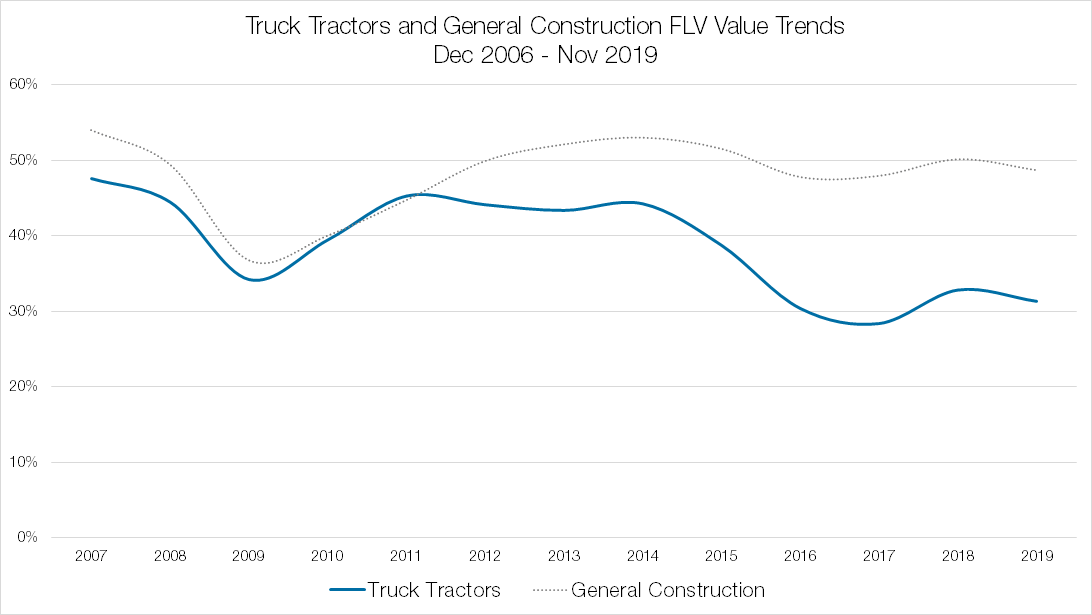
These industry dynamics are apparent in recent value trends. Rouse tracks auction data for truck tractors in addition to construction equipment. Below is a chart of the FLV value trend of both truck tractors and general construction equipment, which is an aggregation of aerial, telehandler, earthmoving, and support equipment.

Focusing on the most recent two years in the chart below, 2018 auction sales displayed an upward trend mirroring the relative strength in the trucking industry. In 2019, the aforementioned market forces caused a pullback in the industry which impacted used truck sales prices. Values consistently exhibited a weakening recovery profile across the breadth of truck brands and used vintages. While general construction equipment has also experienced similar fluctuations over the past several years, the impact of market forces was not as significant on general construction equipment values. Trucking companies face a unique set of challenges and values are more susceptible to volatility.

2018 was a strong year for the transportation and logistics industry as many companies posted record revenues driven primarily by high load rates. Trucking capacity was constrained by the driver shortage and demand was heightened as companies wanted to deliver their goods prior to the impending tariffs on China. Spot rates were well over $2.00 per van truck load mile through all of 2018, driving a surge in revenues.

As a result of the booming market in 2018, trucking companies fleeted up heavily to both capitalize on expanding margins and to beat the tariff increases. Logistics companies purchased a record number of class 8 tractors. However, this increased investment in new trucks led to an oversupply in the market. Furthermore, the Cass Freight Index indicates that freight shipment volumes declined in 2019 relative to prior year. The combination of weakened demand and increased supply drove down truckload rates. For most of 2019, van rates fell into the $1.80’s according to DAT’s rate data.

Other challenges included rising insurance rates and persistent driver shortages, which forced transportation companies to raise driver pay. As a result, revenues declined and expenditures increased, leading to significant financial pressures and resulting in the spike of bankruptcies in 2019.

The recent bankruptcy filing by Celadon, one of the largest logistics and transportation companies in North America, is illustrative of the current struggles of many companies in the industry. Celadon is the latest notable shutdown, adding to the tally of 795 carriers that have gone bankrupt through 3Q19 according to transportation data firm Broughton Capital. This count is double the number of trucking bankruptcies through the same period in 2018. Although 2018 marked a strong year for the logistics industry, 2019 quickly turned due to a softening spot rate environment, falling demand, and increasing costs of driver pay and insurance.

Although Celadon represents only a small fraction of the total industry, the broader market picture displays significant economic headwinds in the current climate. Slowing freight demand has caused order books for heavy-duty truck manufacturers to decrease and new truck orders are returning to normal market levels. In 2020, the environment is uncertain and trucking companies are being cautious. The used truck market continues to display weakness in value recovery. Rouse will track and report on this data as the year unfolds.

Rouse collects and tracks over $550 million of truck tractor sales and $160m of trailer sales annually spread across nearly 750 tractor models and over 4,000 trailer models. This information is used to conduct studies and analyses of used truck and trailer value trends by incorporating make, model, year, mileage, brand, region, and other factors that may be consequential to the valuation needs of our clients and for us to deliver the most accurate valuations in the industry.

ABL Guidance for Construction Equipment: Key Focus Areas (Part 1 of 3)

As an asset-based lender your goal is to minimize your risk exposure and optimize the financing structure and availability for your borrower. Rouse takes a ‘360’ view on tracking all aspects of the construction equipment market by maintaining the most complete database of secondary market transactions to tracking key market indicators. In this three-part series we’ll explore the critical areas that ABL teams can focus on to ensure proper management of the credits in their machinery & equipment portfolios. In part one of this series we’ll begin with a focus on understand the market. The first element of this is…

Market Tracking

Lenders need to maintain a sharp view and focus on what is currently happening in the marketplace for construction equipment. Values tend to move in cycles and dependent upon the cycle should be evaluated accordingly. Through the rich data set of transactions that Rouse collects and manages, Rouse has developed a real-time index that tracks construction equipment values dating back to the 2000’s, as seen below:

 Each monthly data point illustrated above represents the average recovery, as a percentage of cost, for ten different model years of equipment ranging from new to nine years old, with each year weighted equally. The categories contained within include, aerial equipment, telehandlers, support equipment, and small-medium earthmoving equipment, each having an equal impact.

Is the market in a state of growth? Are we at peak levels? Should we anticipate a future downturn? These are all questions a Lender should look to contextualize within the ABL structure and plan for as they may have adverse / favorable effects on future availability. Rouse tracks secondary market values and trends on a month-to-month basis, making the trends available for customers through our monthly Equipment Report. Keeping an eye on the current and future market values provides insight into planning ahead and enables you to assess proposed changes to the borrowing base as well as to…

Understand the ‘Downside’

There should always be a plan for the ‘worst case’ scenario and reserves should be managed accordingly. Below we examine two recent use cases of market downturns and their effects on equipment values.

“Great Recession” declines versus “Mini Recession” declines.  In the value index chart shown above, we show the time period from 2007 through 2018.  Declines in the 2008/09 Great Recession were severe and swift moving down ~21% on a relative Basis for OLVs (holding the fleet profile and age constant).  The downward movement is most extreme for the auction channel of sale (FLV) where peak-to-trough movements were ~-32%.  If we look to the slowdown in late 2014 / early 2015 which was precipitated by the decline in Oil and Gas prices we observe a more moderate reduction in values of ~8.4% on an OLV basis steadily over a period of roughly two years.

Q2 2008 peak pre-drop Q3 2009 trough Peak-to-Trough Q4 2014 peak Q4 2016 trough Peak-to-Trough
FMV 69.6% 60.2% -13.5% 77.1% 73.1% -5.2%
OLV 61.0% 48.0% -21.4% 65.1% 59.6% -8.4%
FLV 52.4% 35.7% -31.8% 53.1% 46.2% -13.0%


The implication in terms of the potential borrowing base and asset values is that there might need to be appropriate asset and capital management to guard against observed declines in values for the equipment. These market movements can play out in a variety of ways depending upon the profile of the asset base which is why it’s critical to…

Keep a pulse on the Collateral

Lenders need to stay ahead to changes in the portfolio to ensure risk is minimized. Too often do we visit a fleet annually or bi-annually to find that values and key lending ratios have shifted dramatically since the prior appraisal. There are a multitude of factors which might drive this including:

  • Market Conditions
  • Changes in fleet age
  • Changes in fleet mix
  • Acquisitions
  • Fleet Maintenance
  • Accounting Practices / Depreciation Policy

It’s important to understand how each of these might drive values and lending ratios, such as the Net Liquidation Value vs. the Net Book Value, up or down. For example, as the company invests in a different type of equipment with less liquidity and a weaker value recovery this might impact availability projections. These changes tend to be gradual as companies manage their fleets.  However, over the course of a period of six months or more these changes may move enough that an updated appraisal can have a meaningful impact to availability / liquidity. Tracking these and having regular conversations with the company enables planning so any changes are baked into the borrowing base. A best practice is to include the optionality to trigger an additional appraisal should material changes happen either with the market, the company’s performance or otherwise.

In the next part of this series we’ll plan to dive deeper into some of the specific components and elements that should be considered as part of the ABL setup and management.

For further information or discussion feel free to contact Raffi Aharonian (Raffi.Aharonian@rouseservices.com) or Jacob McCarthy (Jacob.McCarthy@rouseservices.com).


Transaction Trends

The strong economy of recent years has brought increased growth to the equipment rental industry. Increased preference for rental over ownership (i.e., higher degree of rental penetration) has contributed to this growth. The industry has also experienced a high degree of acquisitive growth via consolidation of local, regional, and national companies.

Like many other highly fragmented industries, the equipment rental industry has been primed for consolidations.  Since United Rentals acquired RSC in 2011, the industry has witnessed a significant amount of consolidation in both landmark deals and smaller bolt-on acquisitions.

Let’s take a closer look at the transaction environment since 2011, highlighting the transaction multiples observed across the various industry verticals.  Rouse has evaluated more than 120 transactions between equipment rental companies from 2011 to 2019 to showcase their patterns and outcomes.

The common metric for deals in the sector is purchase price as a multiple of trailing 12 months’ EBITDA, or the EV/EBITDA multiple.

Across the industry, the average transaction multiple in the North American market (US and Canada) is 7.1x, with nearly 70% of deals trading at multiples between 5.0x and 8.0x.  Within the European market (including the UK) the average is a little bit lower, at 6.4x, with the majority of deals trading at multiples between 4.5x and 7.5x.

Rouse sees companies that operate in a specialty vertical (traffic solutions, tanks/pumps, etc.) trading at higher multiples, in some cases reaching as high as 9.0x.

Many transactions take place outside the ranges stated above.  Rouse has observed that transaction multiples can vary for a number of reasons, including strategic value, target profitability, and expected synergies via acquisition, as well as situational characteristics such as bankruptcies and market cycles.

No matter the circumstances of a sale, stakeholders across the industry should have a good understanding of the observed transaction multiples.  This becomes important for business owners (buyers and sellers), asset-backed lenders, private equity owners, and corporate finance advisors.

For more information about transaction trends, please contact Raffi Aharonian at Rouse Services (Raffi.Aharonian@rouseservices.com).

Acquisition Accounting and Fair Value

Like many other highly-fragmented industries, the equipment rental industry continues to experience frequent consolidations.  Although consolidation presents many opportunities for acquirers and sellers, there are challenges that naturally arise as a by-product of these transactions.

One such challenge is undertaking the accounting end of the acquisition, most notably adherence to the guidance offered by the financial accounting standards – in this case, FAS 157 and ASC 820.  The acquiring companies need to assign an appropriate “fair value” (not to be confused with the similar-sounding “fair market value”) as they bring those assets onto their balance sheets.  But it’s not so easy – accounting standards can often be confusing, oftentimes leading financial teams to consume time and resources only to find out that their application of the rules does not pass auditors’ requirements.

First, a little bit of background on the accounting principles:

Fair Value is measured and calculated in line with the financial reporting standards as established by the Financial Accounting Standards Board (FASB).  Fair Value is the price that would be received to sell an asset or paid to transfer a liability in an orderly transaction between market participants at the measurement date.

In considering the fair value of the assets owned by the company, it is important to consider both the core valuation criteria as outlined by FAS 157 and FASB ASC 820 (amendments to FAS 157 issued by the ASC), including:

  • Measurement Date: this should coincide with the closing date of the transaction.
  • Market Participants: Fair Value should be considered from the perspective of the company and considers the price other similar equipment rental / dealer companies might pay for those same assets.
  • Orderly Transaction: Fair Value is derived assuming there is no undue pressure or inclination to sell the assets.

So how does one apply the accounting principles into practice?

Much like a traditional retailer who acquires inventory and applies a mark-up for resale, equipment rental companies purchase fleet assets (their equivalent of inventory) for purposes of renting that equipment to their customers.  As a result, it is not uncommon for rental companies to purchase assets at a wholesale price point (i.e., a discount to retail prices).

In turn, this phenomenon can make it challenging to arrive at a fair value measurement in the context of an acquisition of used fleet. It takes an experienced partner and a rich source of market observations to accurately assign fair value that will stand up to the accounting guidance and ultimately the auditors’ acceptance of a company’s financial reporting.

As a result of its extensive network of participants, Rouse receives over $1.5 billion in wholesale equipment sales transaction data annually and analyses these values (on a monthly basis) at a make / model / spec / year level to drive the Fair Value analyses needed by its clients.  Rouse’s rental and dealer clients provide Rouse with detailed transaction data on all the equipment they sell. This transaction data is routinely updated in Rouse’s database, providing a comparable-backed appraisal source for fair values.

Count on Rouse to deliver the most accurate fair value reports, supported by true market reference points and extensive experience.  Contact Rouse for a free consultation on your fair value needs.

Know the Value: Reconditioning Your Machines

For any equipment rental operator, there is the necessary struggle of managing asset life cycles in order to optimize the balance for customer satisfaction, reliability, and cost control.  This often comes hand in hand with a company’s asset replacement strategies – namely disposing older assets and replacing them with a fresh machine.

Over the course of the last 15 years, the notion of rehabbing assets has taken hold as a mechanism for extending rental useful life at a reasonable cost.  However, along the way, the idea of investing in your assets has taken many forms and with the use of a wide range of vocabulary: refurbishment, repair, remanufacture, recondition etc.  It can all become confusing when the terms may or may not have different meanings and when they are used interchangeably.  The range of outcomes can vary from fresh paint / tires to a complete overhaul of the machine inclusive of a new engine and extended warranty.  In this report, we will study the current accepted standards for reconditioning along with the added value these programs can bring to rental companies.

Firstly, what is it?

In the current state of the market, Rouse recognizes the term “reconditioning” as the generally accepted standard for overhauling a machine for extended life (sometimes termed “second life”).  Although reconditing is observed for a wide range of products, this practice tends to be most commonly seen in aerial work platforms, namely telescopic booms.  Rouse looks to the leading original equipment manufacturers (OEMs) of boom lifts as the benchmark for reconditioning work performed on these machines.  The scope of work that the OEMs undertake tend to be the richest scope and meet their respective standards.  This stands in contrast to work that might be performed at a third-party repair shop who may not otherwise undertake the full extent of the typical work order.  The typical work orders for an OEM may include:

  • Disassembly of the machine to its core
  • Replacement or rebuild of the major components
  • Boom inspections / repairs as needed
  • Fresh paint consistent with new manufacturing standards
  • New tires, new hoses
  • New or rebuilt engine
  • Full safety testing
  • New warranty

With all of that working having been performed, the next logical question is, how does this add value?

There are certainly some interest value propositions offered by the reconditioning programs.  For instance, a rental company can send their equipment for reconditioning (or buy already reconditioned units out of OEM stock) for a price point that can be significantly below the cost of acquiring a new machine.  In many cases, a reconditioned machine can be utilized for 3-5 years beyond its original recondition date without material repair or maintenance needs.  Because the OEMs offer warranties as long as 36 months, this gives rental companies comfort in knowing the product is fully covered and supported by the OEM.  In turn, this translates into an extended rental life where by the rental companies are earning rental revenue streams on the same asset.

Although there are many good reasons for investing in reconditioning programs, rental companies should be aware of the impact on secondary market values for their reconditioned equipment.  Over the course of several years, Rouse has had the opportunity to collect and evaluate a deep pool of data for reconditioned assets that have been put into rental fleets and subsequently sold into the secondary market.  This information comes to Rouse via its relationship with over 150 rental and OEM dealer customers, all of which provide Rouse with their detailed fleet data.  From this fleet data, Rouse has had the opportunity to identify reconditioned assets, validate the nature of the recondition work performed, and analyze the sales observations for purposes of assigning values to these machines.

What is observed is that the average premium that is earned by a reconditioned asset, in comparison to an equivalent make-model-year asset that has not been reconditioned, starts high but erodes fairly rapidly in the first three years.  After approximately four to five years into its “second life”, the market attributes little if any incremental value to reconditioned assets over their un-reconditioned counterparts.  In part, this is explained by the fact that market participants are unlikely to know if an asset was reconditioned to begin with, and in the cases where it is known, the assets may not look or operate materially differently from those that have not been reconditions.  The below chart is a pictorial representation of the average premiums observed from recondition date to the point where the premium erodes.